FORTLANE’S DATABASE ON EV INFRASTRUCTUREEV Data©
Asset-level intelligence for
European EV-charging infrastructure
The European charging infrastructure landscape is expanding rapidly, driven by electrification targets, regulatory pressure, and accelerating private investment. However, strategic decisions increasingly require more than high-level top-down market estimates.
EV Data is Fortlane’s proprietary bottom-up database providing asset-level transparency on charging infrastructure across Europe. By combining granular site data with continuous validation, EV Data enables reliable benchmarking, investment-grade analyses, and fact-based strategic decision-making across the entire value chain.
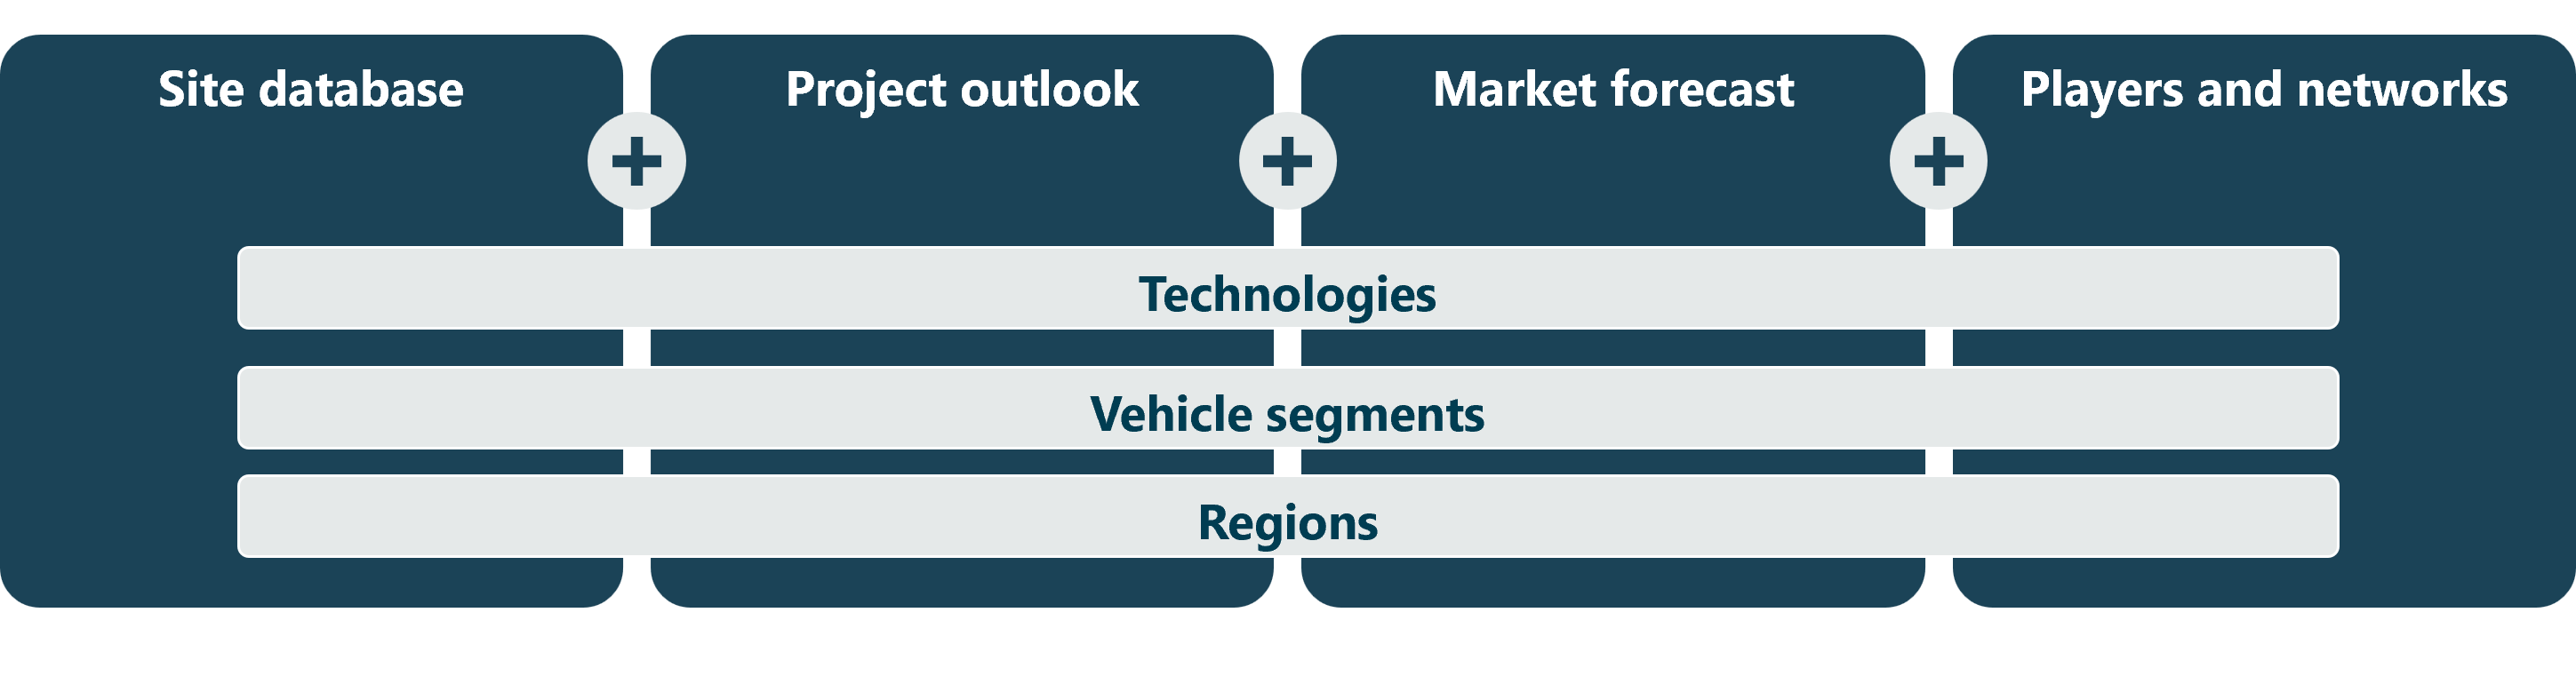
From site-level data to strategic market insights
EV Data integrates multiple dimensions required for a comprehensive understanding of the charging infrastructure market. By combining detailed site-level data with project insights, market outlooks and insights on players and networks, the database enables consistent analyses across technologies, segments and geographies.
Key elements and benefits:
- Overview of all public charging sites
in Europe - Detailed information on capacity, equipment, and financing of locations
- Potentially future addition of database
for e-busses
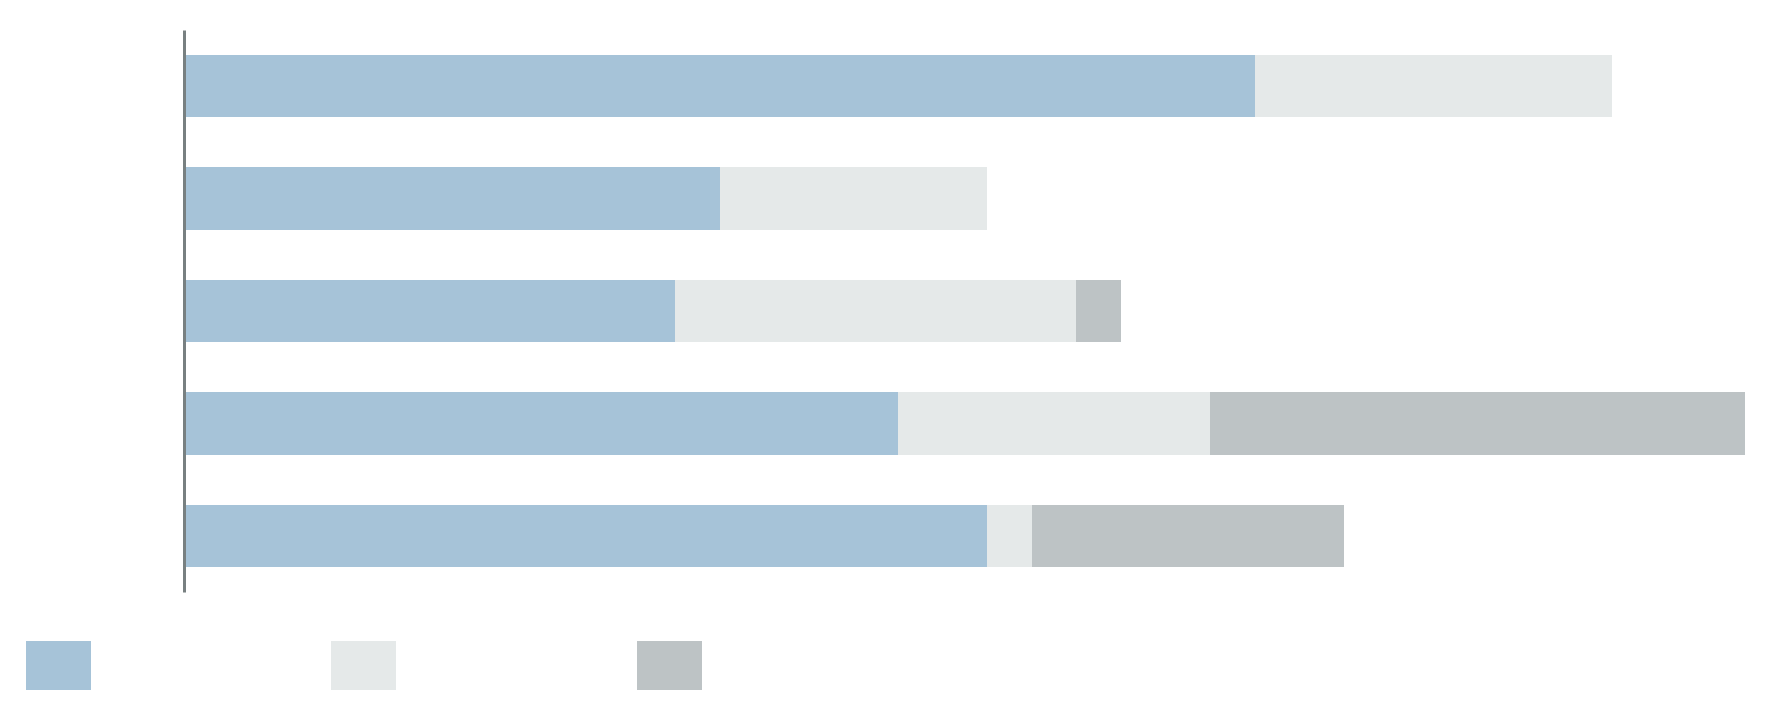
Exemplary result: Age clusters of installed base in a region by manufacturer
Key elements and benefits:
- Information on all current and known future projects/ tenders (continuously updated)
- Identification of market potentials
- Forward-looking insights integrating pipeline charging stations
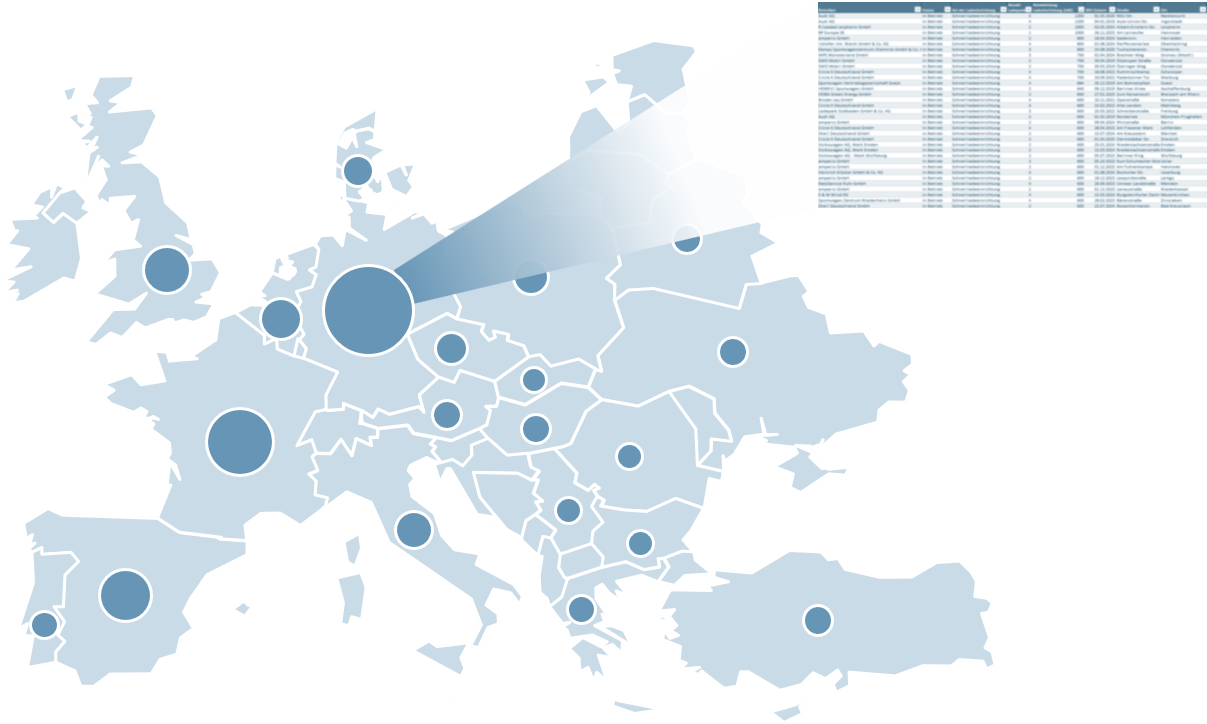
Exemplary result: Project overview by type and region
Key elements and benefits:
- Accurate market projections based on short-, medium- and long-term development drivers
- Achieving a high level of data accuracy though continuous validation of top-down and bottom-up analyses
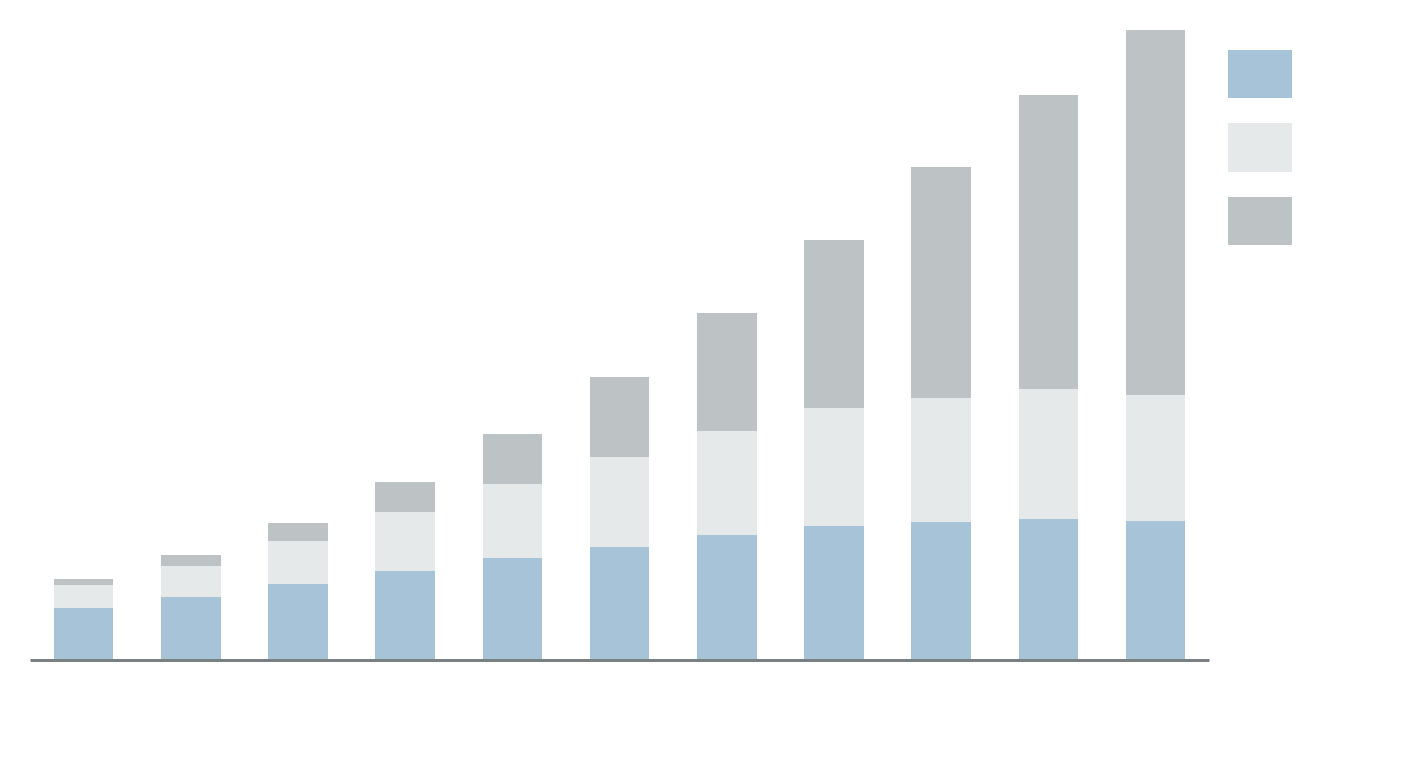
Exemplary result: Development of new installations in a region by charging speed
Key elements and benefits:
- Relevant information on leading players (EBIT, revenues, employee numbers)
- Insights on operator networks (installed capacity, power levels, growth)
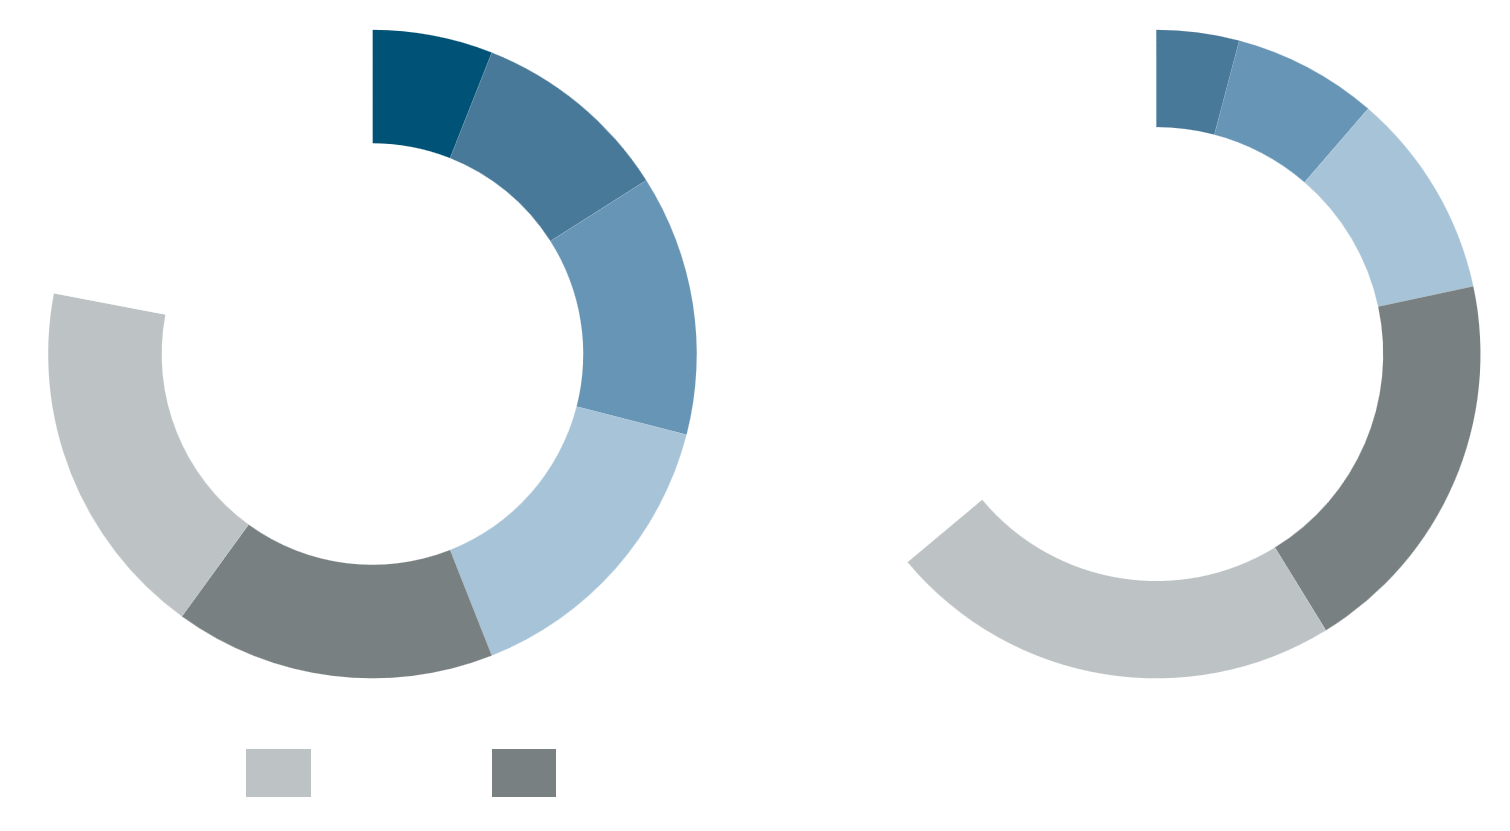
Exemplary result: Market shares by installed base in a region (current vs. 2028)
contact the team< Meet our EV Data experts